Using the Venn diagram probability calculator and problem solver, you can quickly and easily solve problems involving two, three, or four circles.
What is a Venn diagram probability calculator?
Venn diagrams are a helpful tool for showing the connections between different data sets or events. A Venn diagram typically consists of slightly overlapped circles representing a separate event. The possibility that an event will occur is its probability of occurring. Probability always ranges from 0% to 100%, where higher percentages indicate a higher likelihood of the event happening.
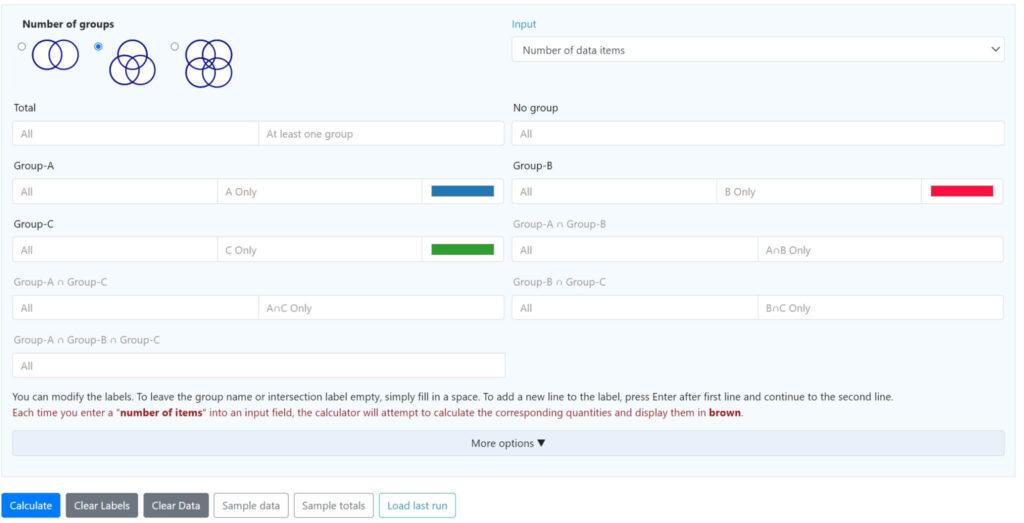
This Venn diagram probability calculator will determine the matching groupings based on the number of items you enter for each group or subgroup. Alternatively, you may select ‘Data list’ as the input box and enter the list for each group. The calculator will then compute the intersections and create the Venn diagram.
How to use the Venn Diagram Calculator
You can solve Venn diagram problems by using the Venn Diagram Calculator:-
Data list:-
The Venn creator will compute all the intersections if you enter the list of objects for each group. In this instance, the “Output” field will show up, and you’ll be able to select one of the following:-
- Amount of data items:- Indicates how many are in each intersection and group.
- Data list:- Displays each group’s and intersection’s items.
- Data list and item quantity:- Displays the total number of items and the items inside each group and intersect.
Number of data items:-
The number of objects in each intersection and group should be entered. Two numbers can be entered for groups that have intersections:-
- All:- the total number of items, taking into account intersections.
- Only:- The quantity of items that are unique members of this particular group.
- The Venn diagram calculator will determine whether it can determine the number of items in any connected group or intersection using the numbers you have previously entered each time you enter a number.
- It will compute the number of items and display it in brown if possible.
- The calculation will be shown on the Venn diagram calculator.
- When you hit the “Calculate” button after entering all the numbers, the Venn diagram creator will create the diagram.
- Even with some missing data, the diagram can still be generated. The figure will only show partial numbers in this instance.
- Only the quantity of items in the smallest groups will be displayed in the diagram.
- For instance, it won’t display a number if ‘A∩B’ exists, but ‘A∩B only’ doesn’t.
Fields of:-
- Title:- Type the chart’s title and select the font size.
- Fill in the font size and subtitle for the chart.
- Enter Data
- List of data
- Quantity of information pieces
- Results
- Solely pertinent to the “Data list”.
- Quantity of information pieces
- List of data
- Quantity of items and data list
- Group: Type in the name and select the hue. Enter the group name in the blank space provided.
- Enter the name of the intersection here. The intersection name is empty; please fill it in.
- Circles: Determine how many circles the Venn diagram has.
- Background: Modify the diagram area’s color.
- The cycle border is the border width. To indicate no border, enter zero.
- border Color
- Darker: This color is darker than the circles.
- Level of darkness: 0 to 100.
- 0: The border and bar color will be the same.
- Black is color 100, the deepest shade of any color.
- One color: The border color you’ve selected for each circle.
- Choose the color for the border.
- Opacity: The opacity of the circles
- Font: Select the font type, size, and color to alter your text’s appearance.
- Download chart: To download a PNG chart, click the camera icon.
- Circle overlap: After the diagram is generated, you can modify a slider to regulate the degree of circle overlap.
- Text Distance: The distance between the text and the center of the diagram. You could take a step back to get more clarity.
- Eliminate all intersection labels: When this option is activated, only numbers are displayed instead of intersection labels.
- Eliminate mutually exclusive crossings: When this feature is activated, intersection numbers and labels that do not overlap are excluded.
- Eliminate no group label: When activated, this feature eliminates the “no group” label.
How do you calculate Venn diagram probability using a calculator?
To determine probability using a Venn diagram:-
- Find out which components of the Venn diagram belong to the subset.
- Determine the subset’s frequency.
- Determine the larger set’s overall frequency.
- Write the probability as a fraction and simplify it.
Example: Venn diagram probability calculator 2 circles
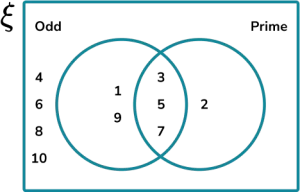
The universal set ξ ={0<x≤ 20, x is an integer}. How probable is it that you will choose a number from the universal set that is not a multiple of 55 but a multiple of 44?
- Verify which components of the Venn diagram belong to the subset. The left circle’s crescent represents the subset of multiples of 4 that are not multiples of 5.’
- Calculate the subset’s frequency.
In this subset, the frequency of numbers is 4.
- Determine the larger set’s overall frequency.
The universal set is the bigger set. Thus, the overall frequency is:
12+4+1+3=20.12+4+1+3=20.
- Write the probability as a fraction and simplify it.
4/20= 1/5
The possibility of selecting from the universal set a multiple of 4 that is not a multiple of 5 is 1/5.


